

- Background: STM as a useful tool.
- Symbiosis between theory and experiment
- The HIVE-STM program
- How to obtain HIVE-STM?
- Some user statistics (2015)
1. STM as a useful tool for theoretical and experimental surface characterization.
From the theoretical point of view, looking at surface-geometries as function of their calculated formation energy doesn’t always tell the entire story and a more direct comparison with experiment is necessary. Most of the comparisons made between theory and experiment are through indirect properties (transport properties, magnetic and spin effects …), which can give useful hints with regard to the validity of the theoretical model used. Direct comparison on the other hand gives a much stronger proof of validity. However, direct comparison is also in general a lot harder to attain.
One direct method of comparing theoretical atomistic models to experimental systems is Scanning Tunneling Microscopy (STM). This method is limited to small systems, and requires from the experimental side high quality (atomic resolution) STM images. However, with modern ab initio methods being able to handle ever larger structures and the constant improvement of experimental STM leading to higher resolution images (i.e. smaller structures), it is now possible to make direct comparison between experimental STM images and calculated STM images.
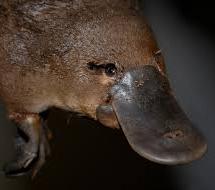
The duck-billed platypus
(Ornithorhynchus anatinus).
2. Symbiosis between theory and experiment.
Although STM images tell an experimentalists a lot, they miss one key piece of information: what are the atomic species observed in the STM images. This blind spot can be alleviated, by comparison to calculated STM images. If calculated and experimentally observed STM images are the same, one can very reasonably assume that the underlying geometry is the same. If it walks like a duck, talks like a duck; than it is most probably a duck…though in some rare circumstances it could still be a platypus. Because the theoretician knows the exact type and location of the atoms with regard to the generated STM image, this symbiosis between theory and experiment results in a chemically sensitive STM.
3. The HIVE-STM program.
The HIVE-STM program is a small piece of software I wrote to generate STM images based on my DFT-calculations. Starting from ab initio VASP calculations, it uses the resulting output to simulate STM images of your theoretical atomic scale model to allow for comparison with experimental STM images.
3. a. What does it do?
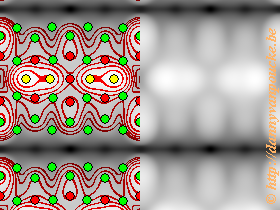
Calculated STM-image of Pt-induced nanowires on a Ge(001) surface. Simulated bias is -1.5V. Countours and atomic positions were also added by the HIVE-STM program.
The program is very rudimentary, but this is possible due to the robustness of STM images. It generates STM images based on the Tersoff-Hamann method, which states that the tunneling-current in an STM experiment is equivalent to the local density of states. This means that a surface of constant current in an STM experiment can be identified with a surface of constant density of states in calculations.
The most crude way of doing this is by neglecting there is an STM-tip (i.e. replace it with a point source) and just plotting a surface of constant density of states (or charge density). This is what the program does, and it allows for ultra-fast generation of different pseudo-STM images. The main drawback of this method is that you end up having more detail than would ever be possible with a real-life STM. On the other hand, a theoretician can never have enough detail 😎 . The image on the left is an example of a calculated STM image generated using the HIVE-STM program, it shows my final model for the Pt induced nanowires I worked on during my PhD.
The program is written Delphi (I wanted a GUI, and the C/C++ and fortran programming-environments available to me at that time didn’t offer this option.) which results in a windows XP executable (it also has been tested on Windows 7, and can be run in unix environments using a windows installation in a virtual box or an emulator like wine).
3. b. How does it work?
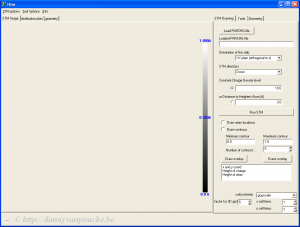
The HIVE-STM program upon startup.
When you start the program the first thing you will need to do is read a partial charge density file that you obtained from VASP calculations (i.e. PARCHG-file). After this you set up the STM parameters: which direction is the surface, how far does the STM tip need to stay above the surface, etc. (Note that the simulated voltage is an input parameter of your VASP-post-processing run which generates the PARCHG file.)
When everything is set up, just hit “run STM“. This is the most time-consuming run since the charge density file needs to be read (a 0.5 GB file can take of the order of minutes 😳 ). However, each following run with the same charge density file only takes 1-2 seconds for a reasonable surface cell. The generated STM image can then be saved as a .bmp file (if you like it, otherwise you can just tweak the parameters a bit more until the desired result is obtained).
Atomic positions and contours can be overlaid (when you save an image, you save the image which you see at that moment, i.e. including atomic positions and/or contours if present). If you click inside the image a small text-box (bottom right) shows you the coordinate and the height position at that point. In the “Tools” section more options become available: such as making a line scan, or a height-distribution of some area of the image.
For more information and a description of most options I refer to [the manual of the program].
3. c. Some examples.
Some examples of the results I obtained during my PhD research on Pt induced nanowires are shown below. Over the years, this program has been distributed to researchers all over the world. A listing of all publications I am aware of that use and cite the HIVE-STM program can be found on this separate page. (If I missed your work, just just let me know and I’ll add it to the list.)
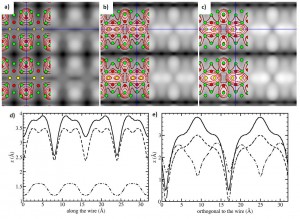
Calculated filled state STM images at a simulated bias of ????1.5 V, of (a) a Pt NW in a Pt-lined trough of the Ge(001) reconstructed surface, (b) and (c) Ge nanowires in a Pt-lined trough of the Ge(001) reconstructed surface. In case of (c) there is an additional Pt atom present in the trough between the two Ge dimers. The green/red/yellow discs show the positions of the Ge/Pt/NW-atoms in these structures. Cross-sections of the STM images (d) along and (e) orthogonal to the wire direction are given for the 3 systems: (a) dash-dotted line, (b) dashed line, and (c) solid line. Figure taken from this paper.
3. d. System requirements.
- Operating System:
- Windows (windows-XP(native), windows-7(tested), windows-10(known to run on it))
- Linux (known to run smoothly using the wine emulator)
- Mac (check out the wine emulator for more information)
- The VASP program (to generate the required partial charge densities), or if you use a different solid state code, a tool that can generate the required charge densities in a file with a CHGCAR-format (check VASP manual).
- Graphics software for post-processing of the images.(Paint is most often sufficient)
- For smooth running I suggest to have more RAM memory available than the size of PARCHG files you wish to use, which should not be an issue for modern day computers and reasonable systems.
4. How to obtain the HIVE STM-program?
The program is freely available as a windows binary for academics interested in using it.This binary was developed on a windows XP operating system, but also runs smoothly under windows 7, and probably under other windows OS’s. This binary has also been successfully run under linux environments using the wine emulator.
If you are interested in using this program, just fill out the registration form, stating your affiliation, interest and topic of research. I’ll provide you ZIP file (~2MB) containing the program, manual (conditions of usage), password and a necessary dll.
5. Some user statistics
Some statistics collected at 19/12/2015 (more info can be found in this blog post)
- # requests: 227
- # countries: 34
- # papers : 25 (listed here)
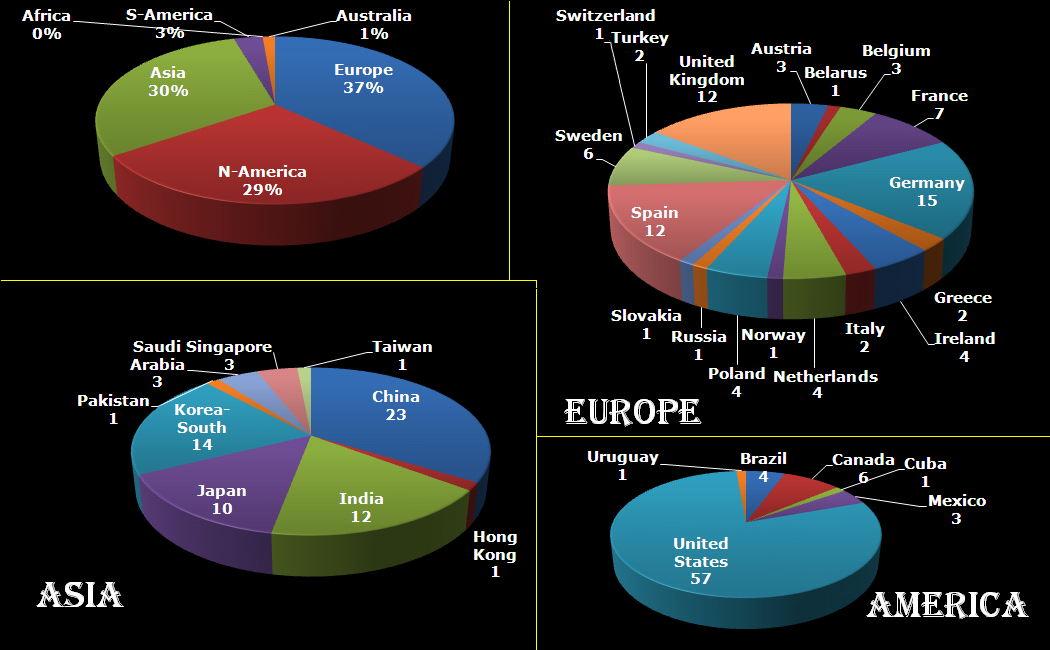
Distribution of Hive requests per country and continent. (1/12/2015)