Category: 2026

Glass Transition Temperature Prediction in Lignin Polyurethanes Using Machine Learning on Small Experimental Dataset

Authors: Silviu Florin Acaru, Marc Comí, Panagiotis Falireas, Danny E. P. Vanpoucke, Richard Vendamme, and Katrien Bernaerts
Journal: Materials & Design 267, 116265 (2026)
doi: 10.1016/j.matdes.2026.116265
IF(2025): 7.9
export: bibtex
pdf: <Mat&Des_267>


Graphical abstract: A machine learning ensemble accurately predicts glass transition temperatures for lignin-based polyurethanes within 6.66°C, despite being trained on a dataset of only 136 formulations. The model efficiently combines seven key features to overcome this data limitation. This optimized workflow generated over 4 million novel lignin-polyurethane formulations, with an intuitive interface accelerating the adoption of sustainable polyurethanes.
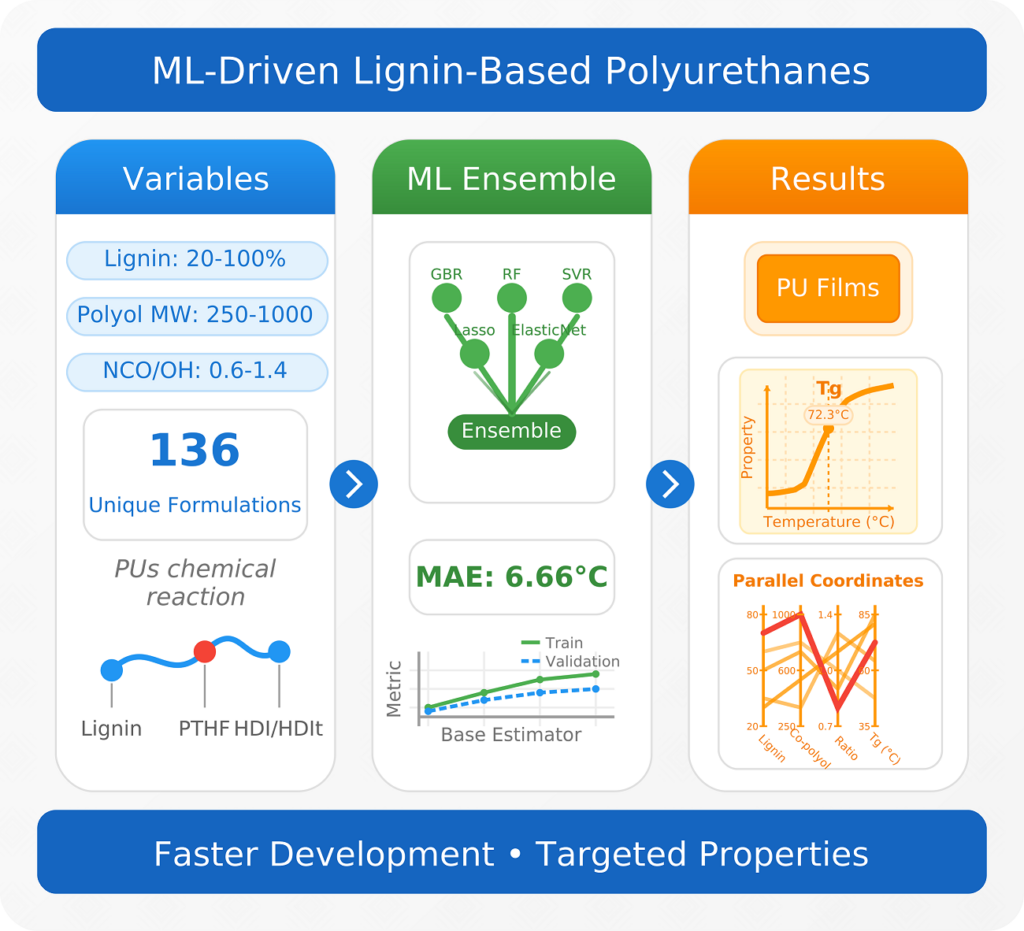
Graphical Abstract: A machine learning ensemble accurately predicts glass transition temperatures for lignin-based polyurethanes within 6.66°C, despite being trained on a dataset of only 136 formulations. The model efficiently combines seven key features to overcome this data limitation. This optimized workflow generated over 4 million novel lignin-polyurethane formulations, with an intuitive interface accelerating the adoption of sustainable polyurethanes.

Abstract

Lignin-based polyurethanes (PUs) offer a compelling route towards sustainable material development, yet the challenge of designing chemical formulations with targeted properties, such as glass transition temperature (Tg), remains unresolved. In this work, we present a systematic approach, to explore key structural parameters—such as lignin content, polyol chain length, isocyanate functionality, and mixing ratios—across 136 unique formulations, creating a diverse dataset of ligninbased PUs. By harnessing this small dataset, we develop a machine learning (ML) ensemble model capable of accurately predicting Tg, with a mean absolute error of just 6.66°C on the validation set, surpassing the performance of conventional regression methods. Additionally, we enhance model interpretability by integrating advanced mapping techniques and employ an adaptive grid search algorithm to explore extrapolative scenarios. Our workflow, paired with a user-friendly interface, enables rapid discovery and optimization of formulations with desired properties. This study not only deepens the understanding of structure-property relationships in lignin-PUs but also provides a scalable ML-driven tool for designing sustainable materials with precision, highlighting the transformative potential of artificial intelligence in green chemistry and materials innovation.

Permanent link to this article: https://dannyvanpoucke.be/2026-paper_digiligninsylviu-en/

Modeling the Zero-Phonon Line of Strained SnV Centers in Diamond; Including Reflections on Computational Cost and Accuracy.

Authors: Danny E.P. Vanpoucke
Journal: Diam. Relat. Mater. 165, 113669 (2026)
doi: 10.1016/j.diamond.2026.113669  (SI: 10.1016/j.diamond.2026.113735)
IF(2024): 5.1
export: bibtex
pdf: <DiamRelatMater> <DRM-corrigendum: SI> <ArXiv (main+SI)>


Modeling SnV color centers under strain.
Graphical Abstract:  The SnV color center is modelled using first principle calculations to predict the zero-phonon-lines in diamond under hydrostatic strain.

Abstract

Among the group-IV vacancy color centers in diamond, the SnV holds promise for photonics based quantum applications. In this work, the Tin-Vacancy (SnV) zero-phonon line (ZPL) and its pressure coefficient are calculated using first principles approaches. The predicted absolute ZPL position is shown to be strongly influenced by the method and supercell size used. The results are therefore extrapolated to the dilute limit allowing for direct comparison with experiments. The importance of identifying the color-center related Kohn–Sham states is highlighted, as well as the shifting of these states due to electron excitations as well as supercell size and k-point position. In contrast to the absolute ZPL positions, the relative position of the SnV0 ZPL is consistently redshifted about 43 nm compared to the SnV ZPL. In addition, the pressure coefficient is shown to be very robust over different methods, always resulting in a value of about 1.4 nm/GPa, for both SnV0 and SnV. Finally, the computational accuracy and cost are put into perspective.

Permanent link to this article: https://dannyvanpoucke.be/2026-paper_snvcolorcenter/