Tossing coins into a fountain brings luck, tossing them of a building causes death and destruction?
 We have probably all done it at one point when traveling: thrown a coin into a wishing well or a fountain. There are numerous wishing wells with legends describing how the deity living in the well will bring good fortune in return for this gift. The myths and legends often originate from Celtic, German or Nordic traditions.
In case of the Trevi fountain, there is the belief that if you throw a coin over your left shoulder using your right hand, you will return to Rome…someday. As this fountain and legend are iconic parts of our western movie history, many, many coins get tossed into it (more than 1 Million € worth each year, which is collected an donated to charity).
In addition to these holiday legends, there also exist more recent “coin-myths”: Death by falling penny. These myths are always linked to tall buildings, and claim that a penny dropped from the top of such a building could kill someone if they hit him.
Traveling with Newton
In both kinds of coin legends, the trajectory of the coin can be predicted quite well using Newton’s Laws. Their speed is low compared to the speed of light, and the coins are sufficiently large to keep the world of quantum mechanics hidden from sight.
The second Law of Newton states that the speed of an object changes if there is a force acting on it. Here on earth, gravity is a major player (especially for Physics exercises). In case of a coin tossed into a fountain, gravity will cause the coin to follow a roughly parabolic path before disappearing into the water. The speed at which the coin will hit the water will be comparable to the speed with which it was thrown…at least if there isn’t to much of a difference in height between the surface of the water and the hand of the one throwing the coin.
But, what if this difference is large? Such as in case of the penny being dropped from a tall building. In such a case, the initial velocity is zero, and the penny is accelerated toward the ground by gravity. Using the equations of motion for a uniform accelerated system, we can calculate easily the speed at which the coin hits the ground:
x = x0 + v0*t + ½ * g * t²
v=v0+g*t
If we drop a penny from the 3rd floor of the Eiffel Tower (x0=276.13m, x=0m, v0=0 m/s, g=-9.81m/s²) then the first equation teaches us that after 7.5 seconds, the penny will hit the ground with a final speed (second equation) of -73.6 m/s (or -265 km/h)*. With such a velocity, the penny definitely will leave an impression. More interestingly, we will get the exact same result for a pea (cooked or frozen), a bowling ball, a piano or an anvil…but also a feather. At this point, your intuition must be screaming at you that you are missing something important.
All models are wrong…but they can be very useful
 The power of models in physics, originates from keeping only the most important and relevant aspects. Such approximations provide a simplified picture and allow us to understand the driving forces behind nature itself. However, in this context, models in physics are approximations of reality, and thus by definition wrong, in the sense that they do not provide an “exact” representation of reality. This is also true for Newton’s Laws, and our application above. With these simple rules, it is possible to describe the motion of the planets as well as a coin tossed into the Trevi fountain.
So what’s the difference between the coin tossed into a fountain and planetary motion on the one hand, and our assorted objects being dropped from the Eiffel Tower on the other hand?
Friction as it presents itself in aerodynamic drag!
Aerodynamic drag gives rise to a force in the direction opposite to the movement, and it is defined as:
FD= ½ *Rho*v²*CD*A
This force depends on the density Rho of the medium (hence water gives a larger drag than air), the velocity and surface area A in the direction of movement of the object, and CD the drag coefficient, which depends on the shape of the object.
If we take a look at the planets and the coin tosses, we notice that, due to the absence of air between the planets, no aerodynamic drag needs to be considered for planetary motion. In case of a coin being tossed into the Trevi fountain, there is aerodynamic drag, however, the speeds are very low as well as the distance traversed. As such the effect of aerodynamic drag will be rather small, if not negligible. In case of objects being dropped from a tall building, the aerodynamic drag will not be negligible, and it will be the factors CD and A which will make sure the anvil arrives at the ground level before the feather.
Because this force also depends on the velocity, you can no longer make direct use of the first two equations to calculate the time of impact and velocity at each point of the path. You will need a numerical approach for this (which is also the reason this is not (regularly) taught in introductory physics classes at high school). However, using excel, you can get a long way in creating a numerical solution for this problem.[Excel example]
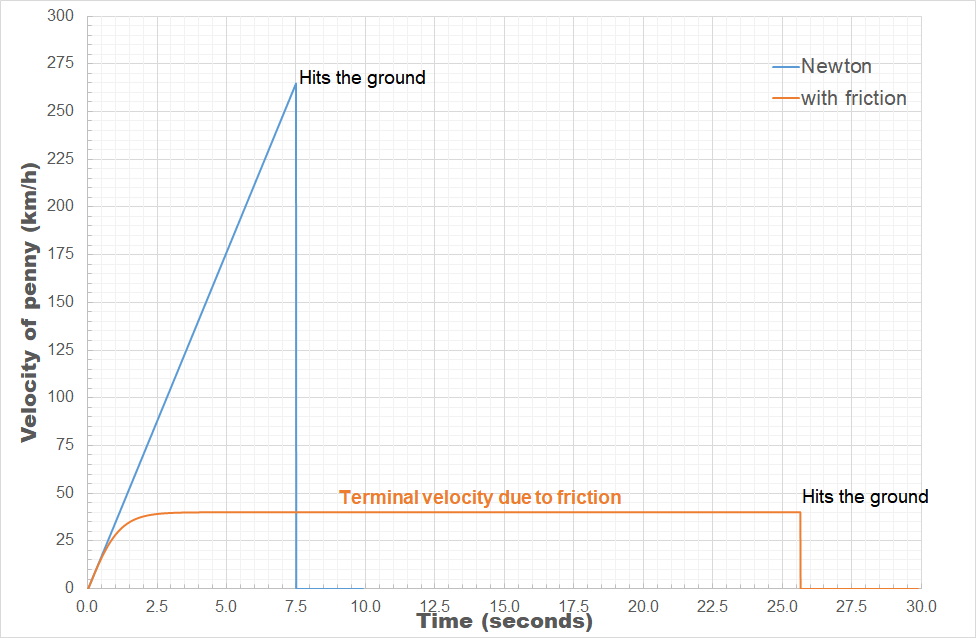
As we know the density of air is about 1.2kg/m³, CD for a thin cylinder (think coin) is 1.17, the radius of a penny is 9.5 mm and its mass is 2.5g, then we can find the terminal velocity of the penny to be 11.1 m/s (40 km/h). The penny will land on the ground after about 25.6 seconds. This is quite a bit slower than what we found before, and also quite a bit more safe. The penny will reach its terminal velocity after having fallen about 60 m, which means that dropping a penny from taller buildings (the Atomium [102 m], the Eiffel Tower [276.13 m, 3rd floor, 324 m top], the Empire State Building [381 m] or even the Burj Khalifa [829.8 m]) will have no impact on the velocity it will have when hitting the ground: 40km/h.
This is a collision you will most probably survive, but which will definitely leave a small bruise on impact.
*The minus sign indicates the coin is falling downward.


 Saturday March 20th at 19h00, I have the pleasure of speaking at the TEDxUHasselt 2021 event.
!} p^{n}q^{N-n}")
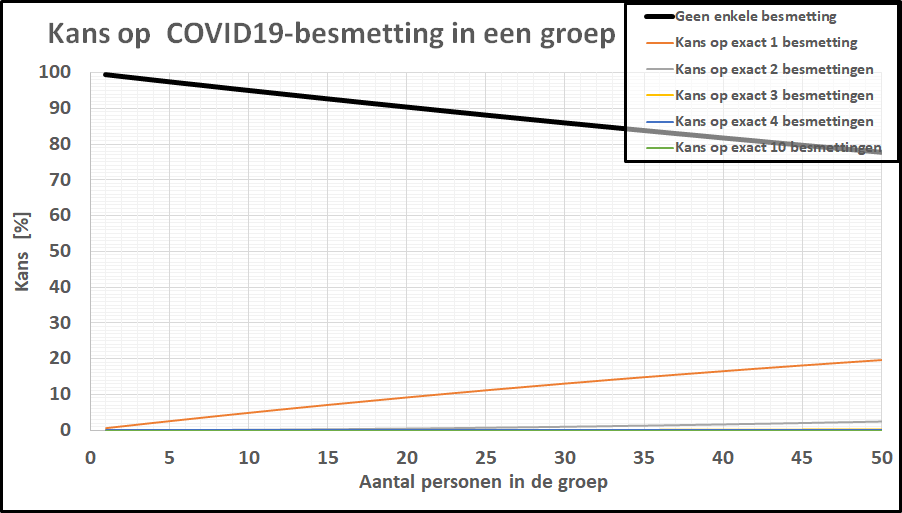
 De kans op minstens één besmet persoon in onze denkbeeldige klas is gestegen tot 20%, terwijl de kans dat de kleine school besmettingsvrij is gebleven is ingezakt tot een magere 20%.
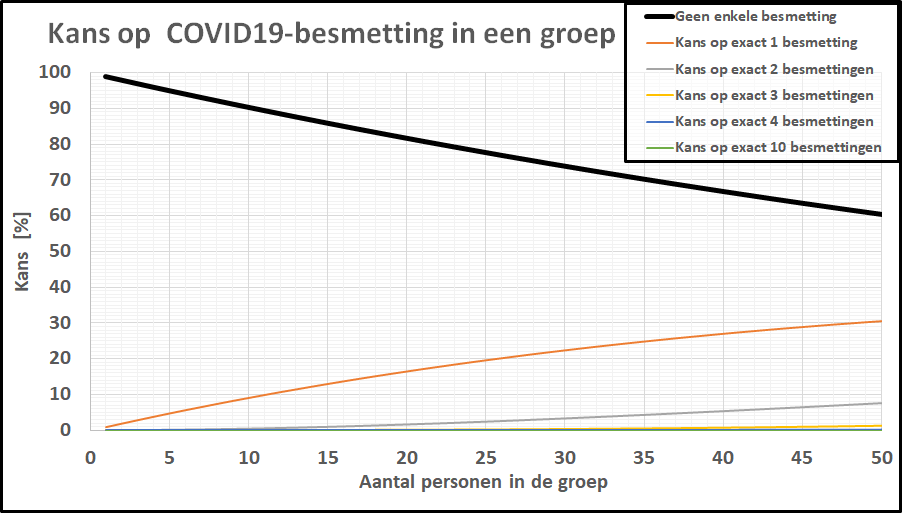
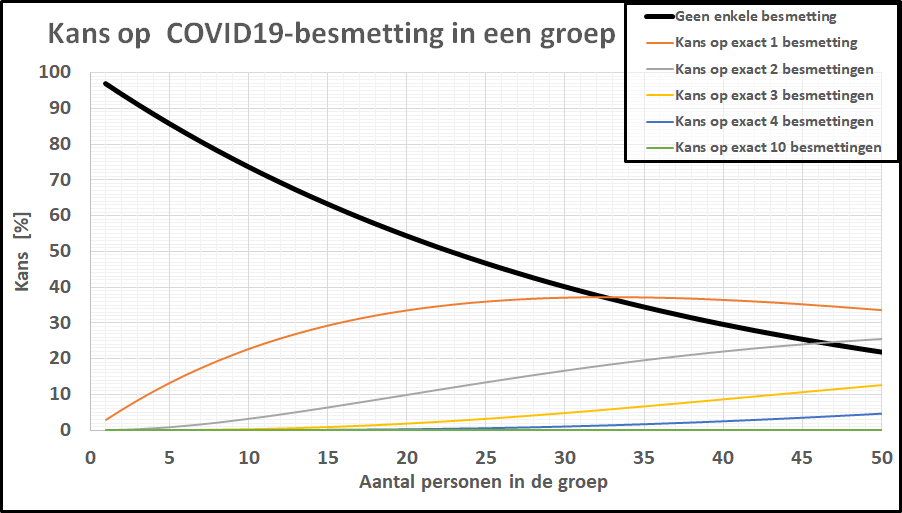 De kans op geen enkele besmetting in een klas van 20-25 leerlingen is gezakt naar 1 op 2! De kleine school, daar hoeven we ons geen illusies over te maken: de kans dat daar geen besmettingen zijn is tot nagenoeg nul gezakt. In een specifieke klas is het intussen ook realistisch geworden dat er meer dan 1 leerling besmet is. Bij deze besmettingsgraad is er zelfs een flinke kans (>10%) op een besmet persoon in een kaartgroep van 4 personen.
 This summer, I had the pleasure of being interviewed by
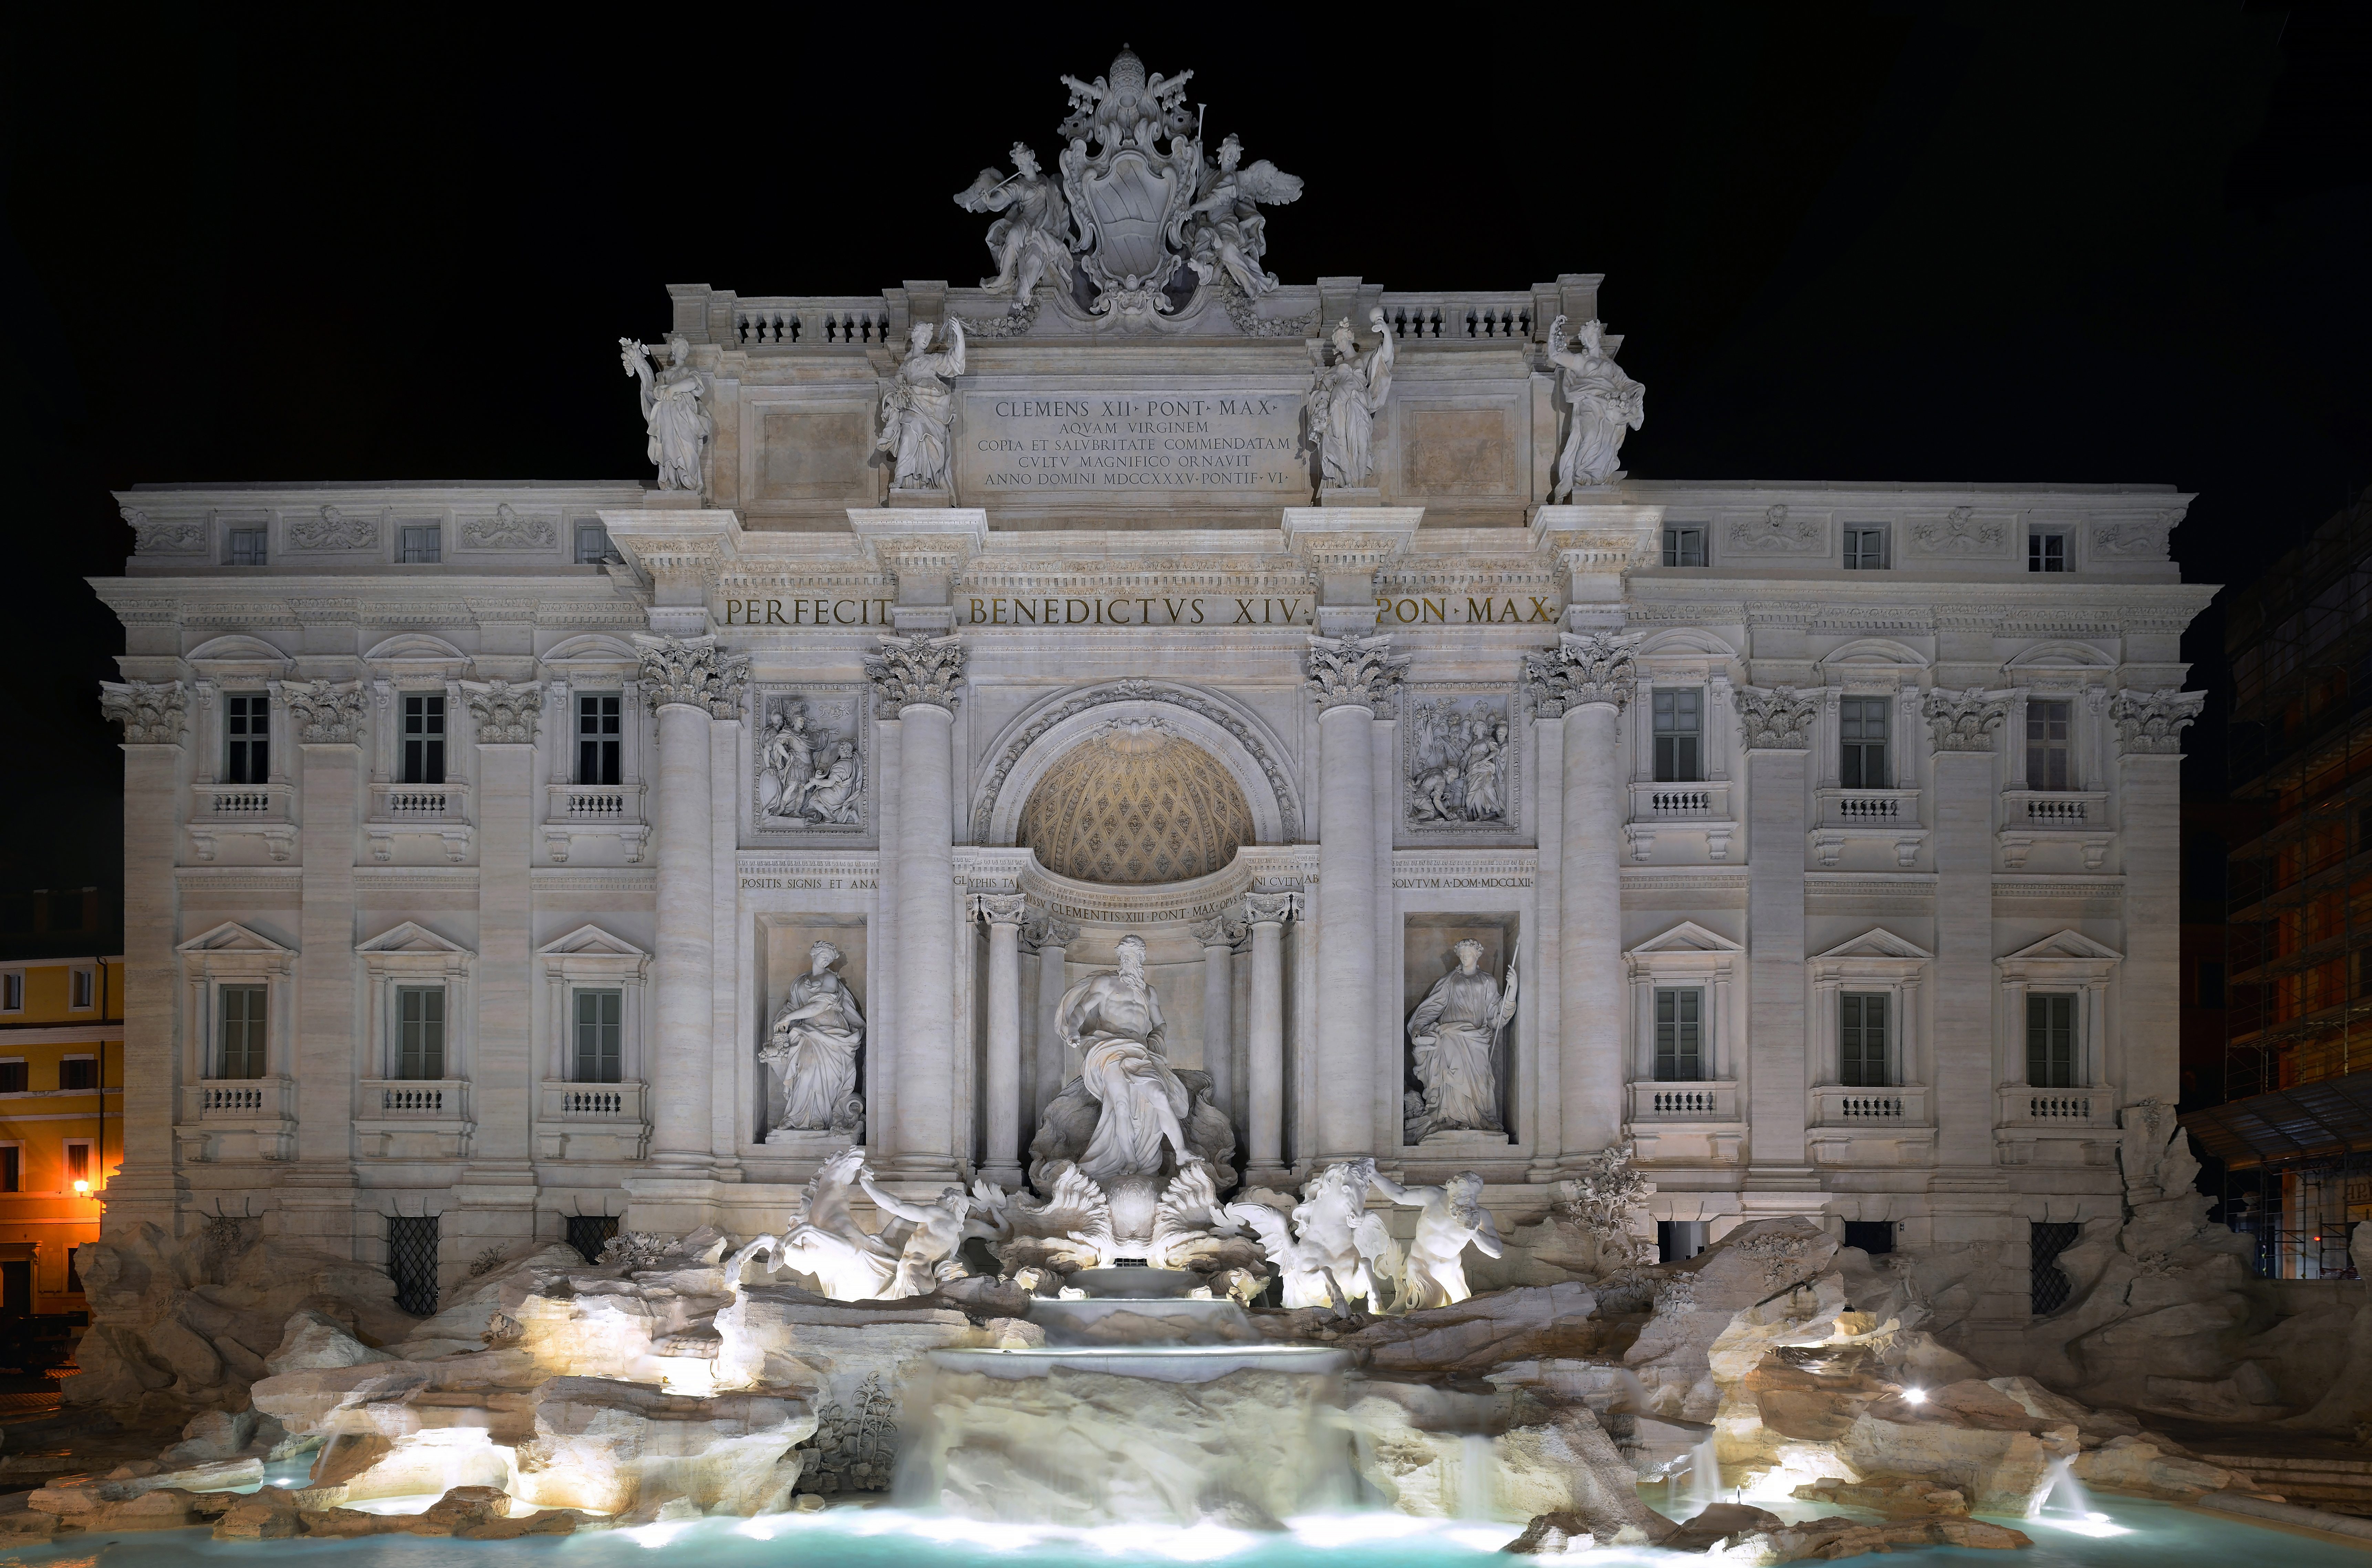
 The power of models in physics, originates from keeping only the most important and relevant aspects. Such approximations provide a simplified picture and allow us to understand the driving forces behind nature itself. However, in this context,