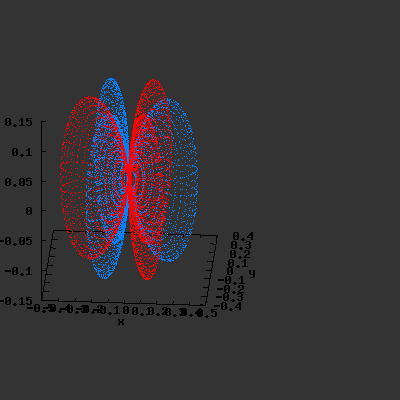
3D f-Orbitals
3D gnuplot-gif-animations of the f-orbitals S03(θ,φ), S23(θ,φ) and
S33(θ,φ). In the images presented, the blue part represents the positive phase, and the red part the negative phase. Note that in gnuplot, the spherical coordinate θ is defined as π/2 – θ. Other than that the definitions of φ and θ coincide with those used in Griffiths’ Introduction to Quantum Mechanics.
For those interested: animations in gnuplot are only available for gnuplot versions > 4.0 (which at the moment of making these animations, was still in beta version).
S03(θ,φ)
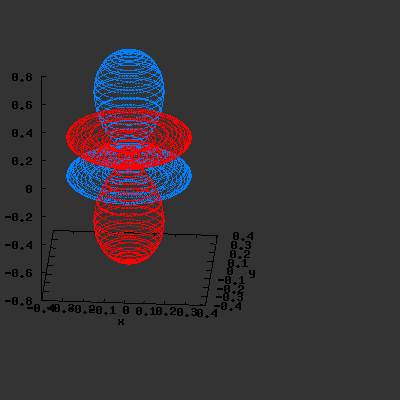
S23(θ,φ)
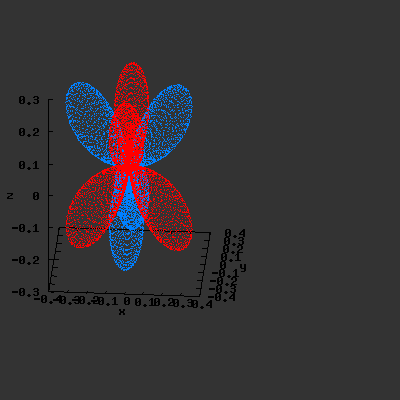
S33(θ,φ)