Category: blog

HIVE-STM: A simple post-processing tool for simulating STM

While I was working on my PhD-thesis on Pt nanowires at the university of Twente, one of the things I needed was a method for simulating scanning-tunneling microscopy (STM) images in a quick and easy way. This was because the main experimental information on on these nanowires was contained in STM-images.

Because I love programming, I ended up writing a Delphi-program for this task. Delphi, being an Object Oriented version of the Pascal-programming language containing a Visual Components Library, was ideally suited for writing an easy to use program with a graphical user interface (GUI). The resulting STM-program was specifically designed for my personal needs and the system I was working on at that time.

In August 2008, I was contacted by two German PhD students, with the request if it would be possible for them to use my STM program. In October, an American post-doc and a South-Korean graduate student followed with similar requests, from which point onward I started getting more and more requests from researchers from all over the world. Now, seven years later, I decided to put all “HIVE-users” in a small data-base just to keep track of their number and their affiliation. I already knew I send the program to quite a lot of people, but I was still amazed to discover that it were 225 people from 34 countries.

Hive Requests December 2015

Bar-graph showing the evolution in requests for the HIVE-STM program.

There is a slow but steady increase in requests over the years, with currently on average about one request every week. It is also funny to see there was a slight setback in requests both times I started in a new research-group. For 2015, the data is incomplete, as it does not include all requests of the month December. Another way to distribute the requests is by the month of the year. This is a very interesting graph, since it clearly shows the start of the academic year (October). There are two clear minima (March and September), for which the later is probably related due to the fact that it is the last month of before the start of the academic year (much preparation for new courses) and, in case of the solid state community, this month is also filled with conferences. The reason why there is a minimum in March, however, escapes me ( 💡 all suggestions are welcome 💡 ).

Hive requests per month.

Distribution of requests for the HIVE-STM program on a monthly basis.

The geographic distribution of affiliations of those requesting the STM-program shows Europe, Azia and America to take roughly equal shares, while African affiliations are missing entirety. Hopefully this will change after the workshop on visualization and analysis of VASP outputs delivered at the Center for High Performance Computing‘s 9th National Meeting in South Africa by Dr. David Carballal. By far the most requests come from the USA (57), followed by China(23) and then Germany(15). South-Korea(14) unexpectedly takes the fourth place, while the fifth place is a tie between the UK, Spain and India(12 each).

Hive requests demographics 2015

Distribution of Hive requests per country and continent.

All in all, the STM program seems to be of interest to many more researchers than I would have ever expected, and has currently been cited about 25 times, so it is time to add a page listing these papers as examples of what can be done with HIVE(which has in the mean time been done, check out useful link n°2).

Happy Hiving to all of you, and thank you for your trust.


Useful link:
[1] More information on the HIVE-STM program and how to acquire it.

[2] List of publications using and citing the HIVE-STM program.

Robbert Dijkgraaf Essay Contest

In the previous posts, I presented my contribution (original Dutch version / English translation) to the Robbert Dijkgraaf essay contest. This year’s theme was on the importance of imagination in science. My girlfriend, Sylvia, also participated in this essay contest. We read each-others contributions as a final check before submission, and at that point it became clear to me I was out of my league 😳 .

During the gala of science in Amsterdam, the winner of the Robbert Dijkgraaf essay contest was made public. And the winner is: Sylvia Wenmackers.

On her blog you can read the winning essay (in Dutch), and you will understand why I immediately knew my essay was outclassed. Congratulations again my dear 😀 .


Sidekick

This year I participated in the Robbert Dijkgraaf essay-contest 2015.
The central theme of the contest was imagination, and in my contribution
I presented the role of imagination in computational materials science,
and why it is so important for this field

The original Dutch version of the essay can be found here.


Imagine a world where you can actually see atoms. Even more, you can use them as LEGOs and manipulate them to do your bidding. Imagine a world in which you can switch off the laws of nature, or create new ones which are more to your liking. In such a world, you are in charge. Welcome to my world: the world of “computational materials science“.

It would be a nice start for a commercial for this research field. The accompanying clip would then show images fading into one another of supercomputers and animations of chemical and biochemical processes at the atomic scale. Moving in a fast-forward pace into our future with science-fiction-like orbital labs where calculated materials are immediately transformed into new medicine, ultra-thin screens and applications for the aerospace industry. scifilabThe ever faster flood of images culminates in the final slogan:”Simulate the future” with a subtext urging you to go study computational materials science. I assume that such a clip would tempt peoples imagination. It addresses our human urge to create, and holds the promise that you can do anything you want, as long as you can imagine it. In fact, your imagination becomes the only limiting factor.

As with most commercial, this one also presents reality slightly more beautiful than it actually is. As for any other scientist in any other field, your contribution to progress as a computational materials scientist is rather more limited than you would like it to be. This is a normal aspect of science. The presented divine omnipotence and omniscience, on the other had, are attainable. As a computational scientist you do have absolute control over the atomic positions and the forces at play. In contrast, an experimental scientist is forced to deal with the quirks of nature and his or her machinery. This omnipotence allows you to create any world you can imagine…inside a computer.

As a scientist, you wish to understand the world around you. This limits the freedom you gained through your omnipotence, unless you would choose to join a team of game-designers. It, however, does not mean that your creativity is curtailed in any way. On the contrary. Where the team of game-designers knows the entire story to be told, including rules and laws of nature relevant for the game world, this is not the case for computational materials science. For the latter it is often their quest to discover the story-line as they go, including relevant laws of nature. As a computational materials scientist, you become the narrator, whose task consist of thinking up new stories time and time again. The narrator, who needs to tweak existing plots, extending or confining story-lines, until the final story fits the shape of reality.

Luckily, you are not alone to bring this daunting task to a successful end. You always have the support of your loyal sidekick: your supercomputer. Using its brute force, your sidekick calculates the effects of any intrigue or plot twist you can imagine. Based on your introductory chapter, in which you describe the world and its natural laws, it will allow the story to unfold. By asking him the right questions, and comparing his answers to reality, you learn which parts of your story don’t really fit reality yet.

Ouroboros benzene. source: wikipediaHow you should rewrite your introductory chapter differs every time. Sometimes it is clear what is going on: an essential character is missing (e.g. an impurity atom which is distorting the crystal lattice), or the character lives at the wrong location (not site A, then let us see about site B?). It becomes more difficult when a character refuses to play the role it was dealt (e.g. Pt atoms that remain invisible for STM, so who is going to play the role of the nanowire we observe?). The most difficult situation occurs with the need for a full rewrite of the introductory chapter. This provides too much freedom, since it is our knowledge of the limitations of reality which provides the necessary support and guidance for drafting the story-line. In such a case, you need an inspiring idea which provides you with a new point of view. Inspiration can come in many forms and at any time, often when least expected. A well-known example is this of the theoretical chemist Kekulé who, in a daydream, saw a snake bite its own tail. As a result Kekulé was able to envision the ring-shape of the benzene molecule. Such wonderful problem solving twists-of-mind are rare. They are often the consequence of long and intense study of a single problem, which drive you to the limit, since they require you to imagine something you have never thought of before. In management-circles this is called “thinking-outside-the-box”, which sound a lot easier than it actually is. It does not mean that all of the sudden everything goes, you always have to bear in mind the actual box you started from.

As a computational materials scientist you have to combine your omnipotence over your virtual world with your power to imagine new worlds, hoping to see a glimmer of reality in the reflections of your silicon chips.

Sidekick

Met dit essay nam ik deel aan de Robbert Dijkgraaf essay-prijs 2015.
Dit jaar was het thema verbeelding, en in mijn bijdrage doe ik een
poging de rol van verbeelding naar voren te brengen binnen
computationeel materiaalonderzoek. Ik probeer eveneens uit te
leggen hoe ik computationeel onderzoek zie als onderzoeksdomein. 

Een vertaling naar het Engels kan hier gevonden worden.


Stel je een wereld voor waarin je atomen kunt zien. Meer nog, je kunt ze stapelen als legoblokken en manipuleren naar eigen goeddunken. Stel je een wereld voor waarin je de natuurwetten kunt aan- of afzetten, een wereld waar je zelf nieuwe natuurwetten kunt schrijven. In zo een wereld heb jij het voor het zeggen. Welkom in mijn wereld, de wereld van het “computationele materiaalonderzoek“.

Het zou een mooi begin zijn van een reclamespot voor dit onderzoeksgebied. In de bijhorende clip krijg je in elkaar overgaande beelden te zien van supercomputers enerzijds en animaties van chemische en biochemische processen op de atomaire schaal anderzijds. Het geheel wordt dan doorgelinkt aan onze eigen toekomst met sciencefictionachtige laboratoria waar de berekende materialen direct worden omgezet tot nieuwe medicijnen, flinterdunne beeldschermen en toepassing voor de ruimtevaart. De steeds sneller elkaar opvolgende beelden scifilabculmineren dan in de slotslogan: “Simuleer de toekomst!” met als onderschrift de aansporing om computationeel materiaalonderzoek te gaan studeren. Ik stel me voor dat zo’n reclameclip wel tot de verbeelding zou spreken. Het spreekt onze menselijke drang om te creëren aan met de belofte dat je alles kunt, als je het je maar kunt voorstellen. Je verbeelding is de enige beperkende factor.

Zoals bij de meeste reclamespots wordt ook in deze de werkelijkheid iets mooier voorgesteld dan ze is. Zoals voor elke andere wetenschapper geldt immers dat je bijdrage aan de vooruitgang beperkter is dan je zou willen. De gepresenteerde goddelijke almacht en alwetendheid liggen wel binnen handbereik. Als computationeel onderzoeker heb je immers absolute controle over de plaatsing van atomen en de inwerkende krachten, iets waar een experimenteel onderzoeker deels is overgelaten aan de grillen van de natuur en zijn of haar apparatuur. Deze controlevrijheid laat je toe, binnen een computer, elke wereld te creëren die je maar kunt bedenken.

Als wetenschapper wil je de wereld om je heen begrijpen, wat bovenstaande vrijheden inperkt, tenzij je ervoor kiest om in een team van computergame-designers aan de slag gaan. Dit betekent niet dat je creativiteit wordt beknot, integendeel. Waar bij het ontwerpteam het volledige verhaal bekend is, inclusief de regels en natuurwetten van de wereld waarin je speelt, is dat niet het geval bij computationeel materiaalonderzoek. Meer nog, vaak is het net je opdracht het verhaal gaandeweg te ontdekken, inclusief de natuurwetten die relevant zijn. Je wordt als het ware een verteller die telkens nieuwe verhalen moet bedenken, of bestaande plots moet aanpassen, uitbreiden of beperken, tot de verhaallijn past in de vorm van de werkelijkheid.

Je staat er gelukkig niet alleen voor om een goede afloop te regelen. Je wordt bijgestaan door je trouwe sidekick: je supercomputer. Deze is in staat met brute kracht de gekste plotwendingen door te rekenen. Op basis van jouw inleidende hoofdstuk, waarin je de wereld en haar natuurwetten schetst, zal hij het verhaal verder laten ontplooien. Door dan de juiste vragen te stellen en de antwoorden met de werkelijkheid te vergelijken kom je erachter waar je verhaal nog niet helemaal in de werkelijkheid past.

Hoe je je inleidende hoofdstuk daarop moet aanpassen verschilt per geval. Soms is het duidelijk wat er aan de hand is: er ontbreekt een cruciaal personage (bijvoorbeeld een onzuiverheidsatoom dat het kristaalrooster verstoord) of het personage woont op de foute plaats (toch niet op de plaats van atoom A, atoom B dan maar?). Moeilijker wordt het als sommige personages weigeren de hun toebedeelde rol te spelen (Die platina-atomen zijn onzichtbaar voor de rastertunnelmicroscoop, wie speelt nu de rol van de zichtbare nanodraad?).Ouroboros benzene. source: wikipedia De lastigste situatie is wanneer een volledige herschrijving van het inleidende hoofdstuk nodig is. Hierdoor krijg je te veel vrijheid in handen, terwijl het net de gekende beperkingen zijn die je houvast geven bij het opstellen van het verhaal. Je hebt dan een idee nodig dat je een link geeft met de werkelijkheid. Inspiratie kan hier velerlei vormen aannemen en op willekeurig moment komen. Een bekende anekdote is deze van de theoretische chemicus Kekulé, die in een dagdroom een slang zichzelf in de staart zag bijten en daardoor de ringvormige structuur van de benzeenmolecule uitdokterde. Zulke wonderlijk probleemoplossende gedachtenkronkels komen zelden spontaan, maar zijn veeleer het gevolg van lang en intens werk op eenzelfde vraagstuk. Dergelijke situaties drijven je tot het uiterste, je moet je immers iets voorstellen waar je nooit eerder aan gedacht hebt. In managementkringen wordt zoiets “buiten het kader denken” genoemd, wat bedrieglijk eenvoudig klinkt. Je mag immers niet vergeten dat voor onderzoek dit niet betekent dat alles plots toegelaten is (met andere woorden, je mag het kader zeker niet uit het oog verliezen bij het dagdromen).

Als computationeel materiaalonderzoeker moet je dus je almacht over je virtuele wereld combineren met je eigen vermogen nieuwe werelden in gedachten te scheppen, in de hoop zo onderweg een glimp van de buitenwereld in je siliciumchip op te vangen.

Publish or perish: of predatory journals and open-access scams

Mantra

In the current academic world, there are two often heard mantra’s: publish more and publish open access. In a world where there are ever more researchers competing for limited financial resources, distribution of these resources needs persistent justification. While funding agencies seem to be in a relentless quest for ‘excellence‘ in research (or just more publications, because that is easily quantifiable), a new side-quest has emerged: ‘open access publication’. This side-quest can either be considered as a move against scientific publishers requesting huge subscription fees from universities or as a further way of justifying what is being done with tax-payer money (with open access the tax-payer can go find out him-/herself ).

Predators

predator by sweens07, http://cyrax-494.deviantart.com/art/Predator-410150978The publish or perish culture has lead to the birth of predatory journals and publishers. These journals more and more act as regular journals (e.g. promising/claiming peer review). However, in the end, as long as a publishing fee is paid your paper will get published. Researchers of ill intend can easily get their work published in such journals and as such inflate their CV. Unfortunately, also poorly informed researchers, with no ill intend, can be trapped by such journals. These journals use rather aggressive mailing campaigns (I generally get a few of these e-mails every week on my academic mail account) and present journals with names rather similar to well established journals. Luckily, after a while you start to recognize the usual predatory publishers such as scirp, bentham science publishers or hindawi publishing. The setup of their mailings are rather similar. There are two main types: the professional journal type and the personal interest type. The first setup starts by presenting their journal as brand new and of high interest to field, indicating that the journal is indexed in several listings (giving it the impression of validity) and finally that there is a publishing charge (which generally isn’t that steep, 100-200$). The second type approaches you noting they have read one of your recent publications, and consider it to be of great quality and interest to the world. After sufficient flattery you are then invited to publish new work with them (which can be done at a special discount).

Predators v2.0

Lately, with the recent quest for open-access publishing (funding agencies/universities requiring of their researchers to publish open access*) these predatory journals moved on. Nowadays, you do not need to pay for publication any longer, you now pay for the “open access” of your work. In my case, the most recent invitation was by intechopen. I was invited to write a chapter in a book on Metal-Organic Frameworks, and since it is open access, it would only cost 670€ in processing charges. No thank you. After a reminder by the publishing process manager I put in the effort to check if they are already blacklisted as a predatory journal/publisher, and yes they are: Jeffrey Beal’s list of predatory publishers. (For the record, if you are invited to write a paper/book-chapter there should be no page/processing charges at all, on the contrary you should actually get a (small) fee.)

How to discern a legitimate journal from a predatory journal?

This question is becoming harder to answer every year. With open access, also regular publishers have discovered a new gold-mine which they are rather eager to excavate. Also with the huge flood of publications that all need to be reviewed by multiple referees, quality in that area starts to degrade slightly but steadily. So what to do?

  1. First, check if it is a journal you have been reading papers from, and remind yourself what ybealls-listou thought of the quality of those papers. You can also ask your colleagues what they think of the quality.
  2. Second, check if the journal actually has an impact factor on for example web of science (if that is the usual practice in your field). This is similar as checking with a credit rating agencies about the status of a country…which may in the long run not be as flawless as expected.
  3. Third, check if the journal/publisher has been blacklisted in the ever expanding list of predatory publishers by Jeffrey Beall. (Although there is some discussion on the validity of the list itself, I believe it to be a good starting point if you are in doubt.)

*They, however, tend to have conflicting standards in this regard. You are on the one hand encouraged to publish in high impact journals and you are required to publish open access. On the other hand however, no additional funding is provided to pay for the open access costs in high impact journals. These costs are often several thousand euros for one publication, or more than half an FWO bench-fee which is to be used for visiting conferences, buying lab equipment or computational resources.

Experimental truths

In statistics there exist a well known aphorism:

All models are wrong but some are useful.

— George Edward Pelham Box, 1919-2013


"George E. P. Box" by DavidMCEddy

“George E. P. Box” by DavidMCEddy

From the point of view of the definition of the word “model” this is true in an absolute sense, since a model implicitly means approximations are made, and as such discrepancies with “the real system” exist. As a result, this real system is considered as the only “not wrong” description of itself. In the exact sciences, the real system is often nature. This may lead some scientists to believe that experimental results, and by extension conclusions based on them, are true by default. When confronted with theoretical results in disagreement with experimental conclusions, the quick response entails a failure of the theoretical model used since it is not real nature that was worked with, but only a model.

Quite often this is true, and leads to the formulation of new and better models of reality: This allowed, for example, Newton’s laws of motion to evolve to special relativity and further to general relativity. However, equally often (in materials science at least) something else may be going on: The scientist may have forgotten that the experimentalist is also using a model to create his/her experimental results. Broadly speaking, experimental results can be categorized as either being direct or indirect results. Direct results are what you could call “WYSIWYG”-results. What you measure is the quantity you are interested in: e.g. contact angles of liquids by measuring the angle between a drop of the liquid and the substrate surface, the scanning tunneling and atomic force microscopy pictures of a surface,… Indirect results on the other hand, require some post-processing of a direct result to obtain the quantity of interest. This post-processing step includes the use of a model which links the direct result to the property of interest. e.g. The atomic structure of a material. Here the direct result would be the measured X-ray diffraction (XRD) spectrum, while the model and its assumptions are nowadays neatly hidden in well-performing software. This software will try to fit known crystal models to obtain lattice parameters and atomic positions for the XRD spectrum provided. This means however that the obtained result is the best fit that can be obtained, which is not necessarily the actual atomic structure.

Graphical Abstract for paper: Fine-tuning the theoretically predicted structure of MIL-47(V) with the aid of powder X-ray diffraction.

Graphical Abstract for paper: Fine-tuning the theoretically predicted structure of MIL-47(V) with the aid of powder X-ray diffraction.

Another important aspect to remember in regard to experimental results is the fact that different samples are truly different systems. For example, a material grown as a single crystal or synthesized as a powder may give subtly different XRD-spectra. In a recent paper with Thomas Bogaerts, we investigated how well different models for the MIL-47(V) Metal Organic Framework (MOF) fitted to experimental XRD spectra of this material. We found that depending on which experimental spectrum (single crystal or powder XRD) we fitted to, a different model was preferred, showing nature to have multiple truths for the same system. The structural difference between these models is minute, since the models entail different spin configurations on the same topology. However, the effort required for the more extended fitting procedure performed by Thomas is well worth it, since it provided a new (indirect) method for determining the spin-configuration in these rather complex structure, giving access to slightly less-wrong models for the future.


Fortran dll’s and libraries: a Progress bar

In the previous fortran tutorials, we learned the initial aspects of object oriented programming (OOP) in fortran 2003. And even though our agent-based opinion-dynamics-code is rather simple, it can quickly take several minutes for a single run of the program to finish. Two tools which quickly become of interest for codes that need more than a few minutes to run are: (1) a progress bar, to track the advance of the “slow” part of the code and prevent you from killing the program 5 seconds before it is to finish, and (2) a timer, allowing you to calculate the time needed to complete certain sections of code, and possibly make predictions of the expected total time of execution.

In this tutorial, we will focus on the progress bar. Since our (hypothetical) code is intended to run on High-Performance Computing (HPC) systems and is written in the fortran language, there generally is no (or no easy) access to GUI’s. So we need our progress bar class to run in a command line user interface. Furthermore, because it is such a widely useful tool we want to build it into a (shared) library (or dll in windows).progress_1pct

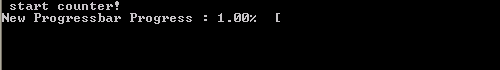
The progress bar class

What do we want out of our progress bar? It needs to be easy to use, flexible and smart enough to work nicely even for a lazy user. The output it should provide is formatted as follows: <string> <% progress> <text progress bar>, where the string is a custom character string provided by the user, while ‘%progress’ and ‘text progress bar’ both show the progress. The first shows the progress as an updating number (fine grained), while the second shows it visually as a growing bar (coarse grained).

  1. type, public :: TProgressBar
  2. private
  3. logical :: init
  4. logical :: running
  5. logical :: done
  6. character(len=255) :: message
  7. character(len=30) :: progressString
  8. character(len=20) :: bar
  9. real :: progress
  10. contains
  11. private
  12. procedure,pass(this),public :: initialize
  13. procedure,pass(this),public :: reset
  14. procedure,pass(this),public :: run
  15. procedure,pass(this),private:: printbar
  16. procedure,pass(this),private:: updateBar
  17. end type TProgressBar

All properties of the class are private (data hiding), and only 3 procedures are available to the user: initialize, run and reset. The procedures, printbar and updatebar are private, because we intend the class to be smart enough to decide if a new print and/or update is required. The reset procedure is intended to reset all properties of the class. Although one might consider to make this procedure private as well, it may be useful to allow the user to reset a progress bar in mid progress.(The same goes for the initialize procedure.)

  1. subroutine run(this,pct,Ix,msg)
  2. class(TProgressBar) :: this
  3. real::pct
  4. integer, intent(in), optional :: Ix
  5. character(len=*),intent(in),optional :: msg
  6.  
  7. if (.not. this%init) call this%initialize(msg)
  8. if (.not. this%done) then
  9. this%running=.true.
  10. this%progress=pct
  11. call this%updateBar(Ix)
  12. call this%printbar()
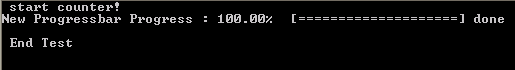
  13. if (abs(pct-100.0)<1.0E-6) then
  14. this%done=.true.
  15. write(*,'(A6)') "] done"
  16. end if
  17. end if
  18.  
  19. end subroutine run

In practice, the run procedure is the heart of the class, and the only procedure needed in most applications. It takes 3 parameters: The progress (pct), the number of digits to print of pct (Ix),and the <string> message (msg). The later two parameters are even optional, since msg may already have been provided if the initialize procedure was called by the user. If the class was not yet initialized it will be done at the start of the procedure. And while the progress bar has not yet reached 100% (within 1 millionth of a %) updates and prints of the bar are performed. Using a set of Boolean properties (init, running, done), the class keeps track of its status. The update and print procedures just do this: update the progress bar data and print the progress bar. To print the progress bar time and time again on the same line, we need to make use of the carriage return character (character 13 of the ASCII table):

write(*,trim(fm), advance='NO') achar(13), trim(this%message),trim(adjustl(this%progressString)),'%','[',trim(adjustl(this%bar))

The advance=’NO‘ option prevents the write statement to move to the next line. This can sometimes have the unwanted side-effect that the write statement above does not appear on the screen. To force this, we can use the fortran 2003 statement flush(OUTPUT_UNIT), where “OUTPUT_UNIT” is a constant defined in the intrinsic fortran 2003 module iso_fortran_env. For older versions of fortran, several compilers provided a (non standard) flush subroutine that could be called to perform the same action. As such, we now have our class ready to be used. The only thing left to do is to turn it into a dll or shared library.progress_25pct

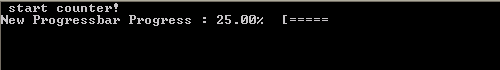
How to create a library and use it

There are two types of libraries: static and dynamic.

Static libraries are used to provide access to functions/subroutines at compile time to the library user. These functions/subroutines are then included in the executable that is being build. In linux environments these will have the extension “.a”, with the .a referring to archive. In a windows environment the extension is “.lib”, for library.

Dynamic libraries are used to provide access to functions/subroutines at run time. In contrast to static libraries, the functions are not included in the executable, making it smaller in size. In linux environments these will have the extension “.so”, with the .so referring to shared object. In a windows environment the extension is “.dll”, for dynamically linked library.

In contrast to C/C++, there is relatively little information to be found on the implementation and use of libraries in fortran. This may be the reason why many available fortran-“libraries” are not really libraries, in the sense meant here. Instead they are just one or more files of fortran code shared by their author(s), and there is nothing wrong with that. These files can then be compiled and used as any other module file.

So how do we create a library from our Progressbar class? Standard examples start from a set of procedures one wants to put in a library. These procedures are put into a .f or .f90 file. Although they are not put into a module (probably due to the idea of having compatibility with fortran 77) which is required for our class, this is not really an issue. The same goes for the .f03 or .f2003 extension for our file containing a fortran 2003 class. To have access to our class and its procedures in our test program, we just need to add the use progressbarsmodule clause. This is because our procedures and class are incorporated in a module (in contrast to the standard examples). Some of the examples I found online also include compiler dependent pragmas to export and import procedures from a dll. Since I am using gfortran+CB for development, and ifort for creating production code, I prefer to avoid such approaches since it hampers workflow and introduces another possible source of bugs.

The compiler setups I present below should not be considered perfect, exhaustive or fool-proof, they are just the ones that work fine for me. I am, however, always very interested in hearing other approaches and fixes in the comments.
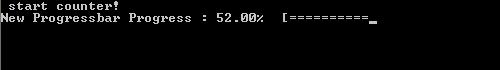
progress_52pct

Windows

The windows approach is very easy. We let Code::Blocks do all the hard work.

shared library: PBar.dll

Creating the dll : Start a new project, and select the option “Fortran DLL“. Follow the instructions, which are similar to the setup of a standard fortran executable. Modify/replace/add the fortran source you wish to include into your library and build your code (you can not run it since it is a library).

Creating a user program : The program in which you will be using the dll is setup in the usual way. And to get the compilation running smoothly the following steps are required:

  • Add the use myspecificdllmodule clause where needed, with myspecificdllmodule the name of the module included in the dll you wish to use at that specific point.
  • If there are modules included in the dll, the *.mod files need to be present for the compiler to access upon compilation of the user program. (Which results in a limitation with regard to distribution of the dll.)
  • Add the library to the linker settings of the program (project>build options>linker settings), and then add the .dll file.
  • Upon running the program you only need the program executable and the dll.

static library

The entire setup is the same as for the shared library. This time, however, choose the “Fortran Library” option instead of Fortran dll. As the static library is included in the executable, there is no need to ship it with the executable, as is the case for the dll.

Unix

For the unix approach we will be working on the command line, using the intel compiler, since this compiler is often installed at HPC infrastructures.

static library: PBar.a

After having created the appropriate fortran files you wish to include in your library (in our example this is always a single file: PBar.f03, but for multiple files you just need to replace PBar.f03 with the list of files of interest.)

  1. Create the object files:
    ifort -fpic -c -free -Tf Pbar.f03

    Where -fpic tells the compiler to generate position independent code, typical for use in a shared object/library, while -c tells the compiler to create an object file. The -free and -Tf compiler options are there to convince the compiler that the f03 file is actual fortran code to compile and that it is free format.

  2. Use the GNU ar tool to combine the object files into a library:
    ar rc PBarlib.a PBar.o
  3. Compile the program with the library
    ifort TestProgram.f90 PBarlib.a -o TestProgram.exe

    Note that also here the .mod file of our Progressbarsmodule needs to be present for the compilation to be successful.

shared library: PBar.so

For the shared library the approach does not differ that much.

  1. Create the object files:
    ifort -fpic -c -free -Tf Pbar.f03

    In this case the fpic option is not optional in contrast to the static library above. The other options are the same as above.

  2. Compile the object files into a shared library:
    ifort -shared PBar.o -o libPBar.so

    The compiler option -shared creates a shared library, while the -o option allows us to set the name of the library.

  3. Compile the program with the library
    ifort TestProgram.f90 libPBar.so -o TestProgram.exe

    Note that also here the .mod file of our Progressbarsmodule needs to be present for the compilation to be successful. To run the program you also need to add the location of the library file libPBar.so to the environment variable LD_LIBRARY_PATH

One small pickle

HPC systems may perform extensive buffering of data before output, to increase the efficiency of the machine (disk-writes are the slowest memory access option)…and as a result this can sometimes overrule our flush command. The progressbar in turn will not show much progress until it is actually finished, at which point the entire bar will be shown at once. There are options to force the infrastructure not to use this buffering (and the system administrators in general will not appreciate this), for example by setting the compiler flag -assume nobuffered_stdout. So the best solution for HPC applications will be the construction of a slightly modified progress bar, where the carriage return is not used.

progress_100pct


Special thanks also to the people of stack-exchange for clarifying some of the issues with the modules.

Source files for the class and test-program can be downloaded here.


Stargazing at the ISS

What happens if two physicists take a holiday? They end up stargazing and hunting for the International Space Station (ISS). During the last week and a half we tried to capture the ISS flybys on camera nearly every night (with varying success). Each night we learned new things:

ISS and starscape

(a) Flyby of the ISS on August 4, 22h38 with a 20 second exposure, and ISO speed of 160. (b) Midnight starscape on august 5th (awaiting the ISS flyby) with a 60 second exposure at ISO-160. (c) and (d) zoomed in sections of (b) showing the color of the stars and arcs due to the earth rotation. (c) shows the a section of sky quite close to the north(small arcs). The arcs shown in (d) are about 15 arc-minute in size. (pictures by Sylvia Wenmackers)

  • Prolonged exposure photography makes night-sky pictures very interesting:
    • The overall sky quickly becomes overexposed (the least bit of final sunlight even after sunset, and the sky turn bright like it is midday, cf. picture (a))
    • Stars truly have colors you can see.(I’m a city boy, and even though as a physicist I am well aware of this it didn’t really fully register before I saw our long exposure pictures with stars in colors varying from green to bright blue(cf. pictures (c) & (d)).⇒And my mind went racing toward a funky programming project to estimate the star’s temperatures.)
    • During a 60 second exposure, the earth rotates 15 arc minutes which actually gives star-trails in our pictures…~7 pixels in the largest trails (cf. picture (d))
    • During a 60 second exposure you can see a hell of a lot of stars, compared to what you normally see (further comparison to the starscape you have living in a city, you could as well be blind).
  • The ISS flyby is very fast (at about 27600km/h), and appears to move faster across the sky than airplanes.
  • With only a few minutes to trace an entire arc through the sky (NASA’s webpage shows times up to 6 minutes, but in reality the local horizon such as trees or houses can significantly reduce this.) The number of attempts to make a prolonged expose picture is limited to 2 or 3 (at best).
  • With a size of ~100 m at an altitude of about 400 km the ISS has a relative size less than 1 arc-minute (or about 0.5 pixels)…so even with binoculars you are still looking at a very bright point.
  • Timing is everything…especially if there are also other satellites passing by, following about the same path, at about the same time, such as the Lacrosse 5 spy satellite. Luckily there are many websites which can provide information on ISS flybys [e.g. here and here(in Dutch)] or any other satellite [here].


Jurassic World

Most kids love dinosaurs, or at some point in life have been intrigued by the idea of the large monsters among them. My inner child still does, so twenty-two years after having seen the original Jurassic Park movie, I watched the first three movies again with my girlfriend, as preparation for its most recent incarnation:Jurassic World.(JP4)

The movie starts from the same premise as the original one (building a theme-park with dinosaurs), but unlike the original, this theme-park is already up and running, and welcoming over 20.000 visitors a day. However, as the mathematician Dr. Ian Malcolm noted in Lost World:

Oh, yeah. Oooh, ahhh, that’s how it always starts. Then later there’s running and screaming.

and so it is in Jurassic world. Everything is peachy, until the genetically engineered Indominus Rex (or the King that can not be mastered/tamed) escapes and runs rampage on Isla Nublar. The representation of a commercialized dinosaur theme-park is scarily realistic: With a type of  kids-farm like section, where little children can hug small dinosaurs and ride baby Triceratops’s, shops selling merchandising, rides through the park and animal (feeding-)shows. Also the modern trend to use abstractions (as euphemisms) to describe negative experiences and events, turns out rather painfully realistic with the automated warning messages to inform the tourists of a “containment anomaly“, when in fact the aviary is breached and the escaped pterodactyls are about to start pecking the above tourists to death.

Continue reading

Congratulations with your 100000000Bth follower Sylvia

For my favorite science-communicator and philosopher of science: Sylvia Wenmackers, congratulations with your 100000000Bth follower on twitter.

It all started just over 4 years ago with a blog on your own webpage, which quickly was accompanied by a blog on scilogs. This in turn lead to a column in EOS, and lately you have been expanding your influence through radio and newspaper (de standaard) contributions (as it is described in the scientific conference language). You are great at explaining things you are enthusiastic about ( something you showed during famelab Belgium) and an excellent writer (FQXi first-prize).

To measure your steep road to science-communicator fame I have a small present for you:

Small present.

Small present.

(Hint: It is not an ugly garden statue, for that you need two bits more 🙂 )